Enhanced Reporting is an easy-to-use data exploration and visualization platform powered by a third-party engine. This tool equips customers with effective ways to find and leverage trends, make data-driven decisions, and share findings through the following:
- Out-of-the-box standard reports
- Option to customize existing reports & charts
- Enhanced Reports Builder for creating new reports & charts from scratch
- Option to publish, download, print & share reports
Enhanced Reporting is ideal for answering standard to complex questions that help customers uncover insights and other opportunities hiding in legal and spend matter data. Data is refreshed once every 24 hours for out-of-the-box reports provided by Unity and reports built or customized by individual users in your environment.
Here's what you'll see with the Enhanced Reports feature:
Accessing and Using the Reports Function
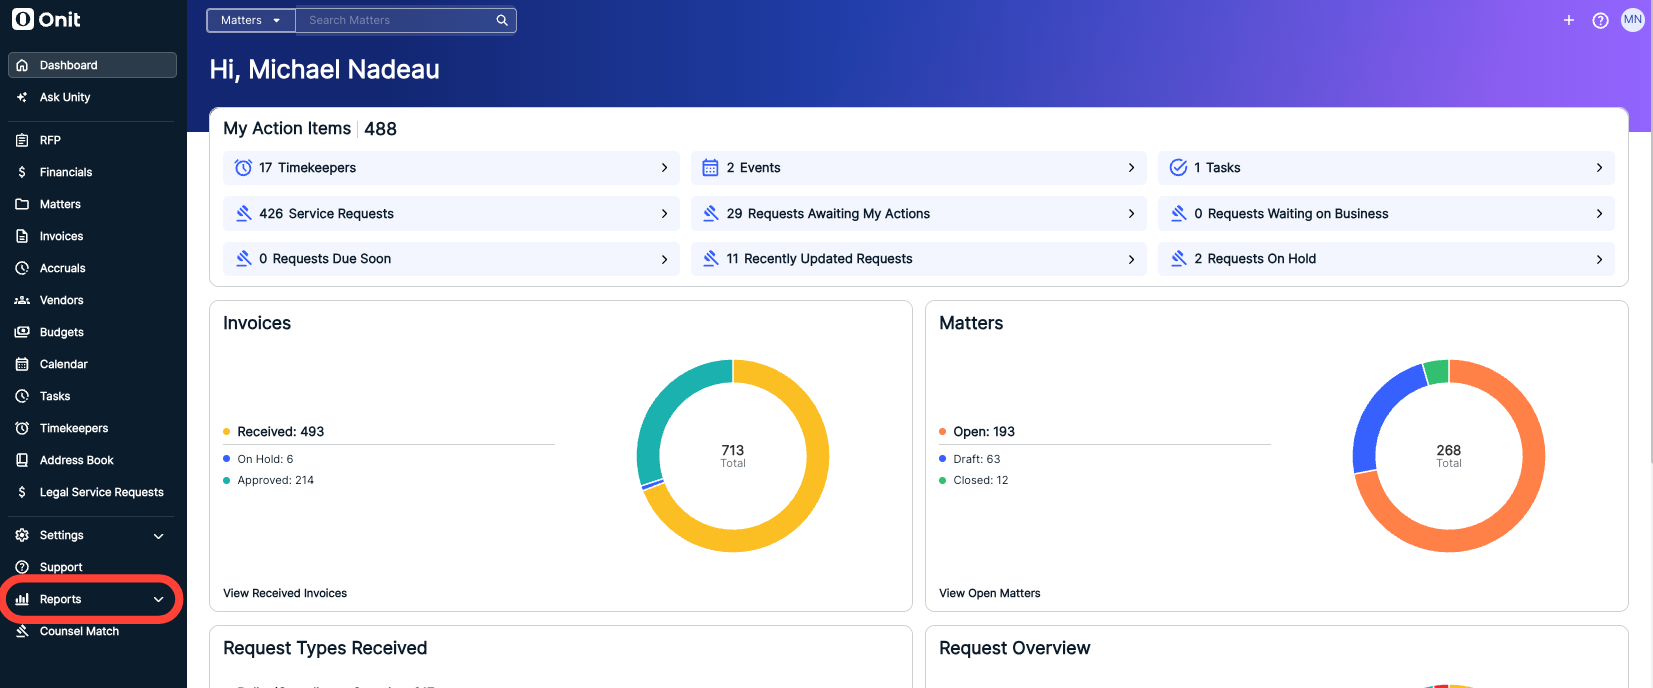
To access the Reports function, click on Reports on the left-side navigation bar menu.
Accessing a Report
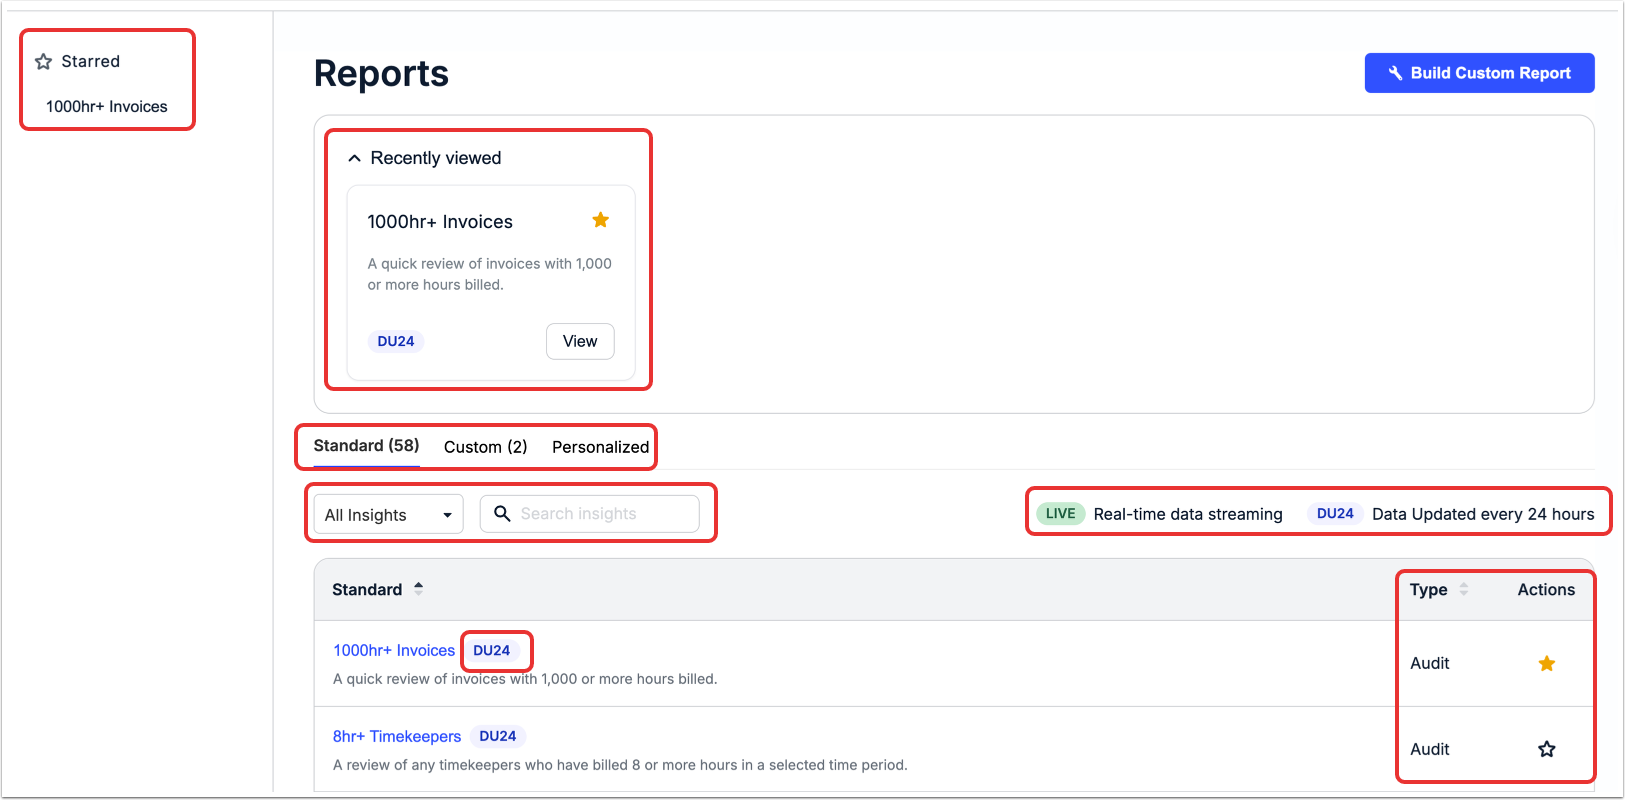
Just as in the Standard Reports, the Enhanced Reports screen is divided into several different sections:
- The Recently Viewed section, which allows you to quickly go to the recently accessed report types. You can Star (favorite) these reports to show them in the Starred section. Click on View to go straight to that report.
- The Starred section, which will allow you to quickly go to your starred (favorite) reports. Click on the Star next to a report to mark it as a favorite.
The Reports detail section, which includes all of the different reports. You can click through to see the Standard, Custom, or Personalized reports, along with the Type of report and an option to Star (favorite) the report. Click on the up/down arrow next to each column name to sort by that column. Click on the drop-down menu to choose from the types of Insights or use the search bar to search for a report.
Standard Reports are pre-built reports available out of the box to all reporting users. These reports are created using HTML (real-time data) and the Enhanced Report Builder (data refreshed every 24 hours), providing immediate access to commonly needed insights without additional configuration.Custom Reports are user-created reports that allow clients to build their own charts and dashboards using the datasets available to them, or to customize, save, and reuse modified versions of standard reports. This enables greater flexibility and self-service reporting tailored to specific business needs.
Personalized Reports are add-on reports designed and built by Onit Services based on a customer’s specific requirements. These reports address unique use cases or advanced analytics needs that go beyond standard and self-service reporting capabilities.
The LIVE green button shows reports that stream real-time data, and DU24 shows reports that are updated every 24 hours (only Enhanced Reports have this designation).
Clicking on an Enhanced report will open the report in a separate browser tab/window. If you get any error messages shown below appear at the top of the page, this means that the out-of-the-box reports or the Enhanced Reports Builder are temporarily unavailable due to a third-party issue. Please check back later. If the issue persists, submit a ticket to support.
Here's what a sample report looks like:
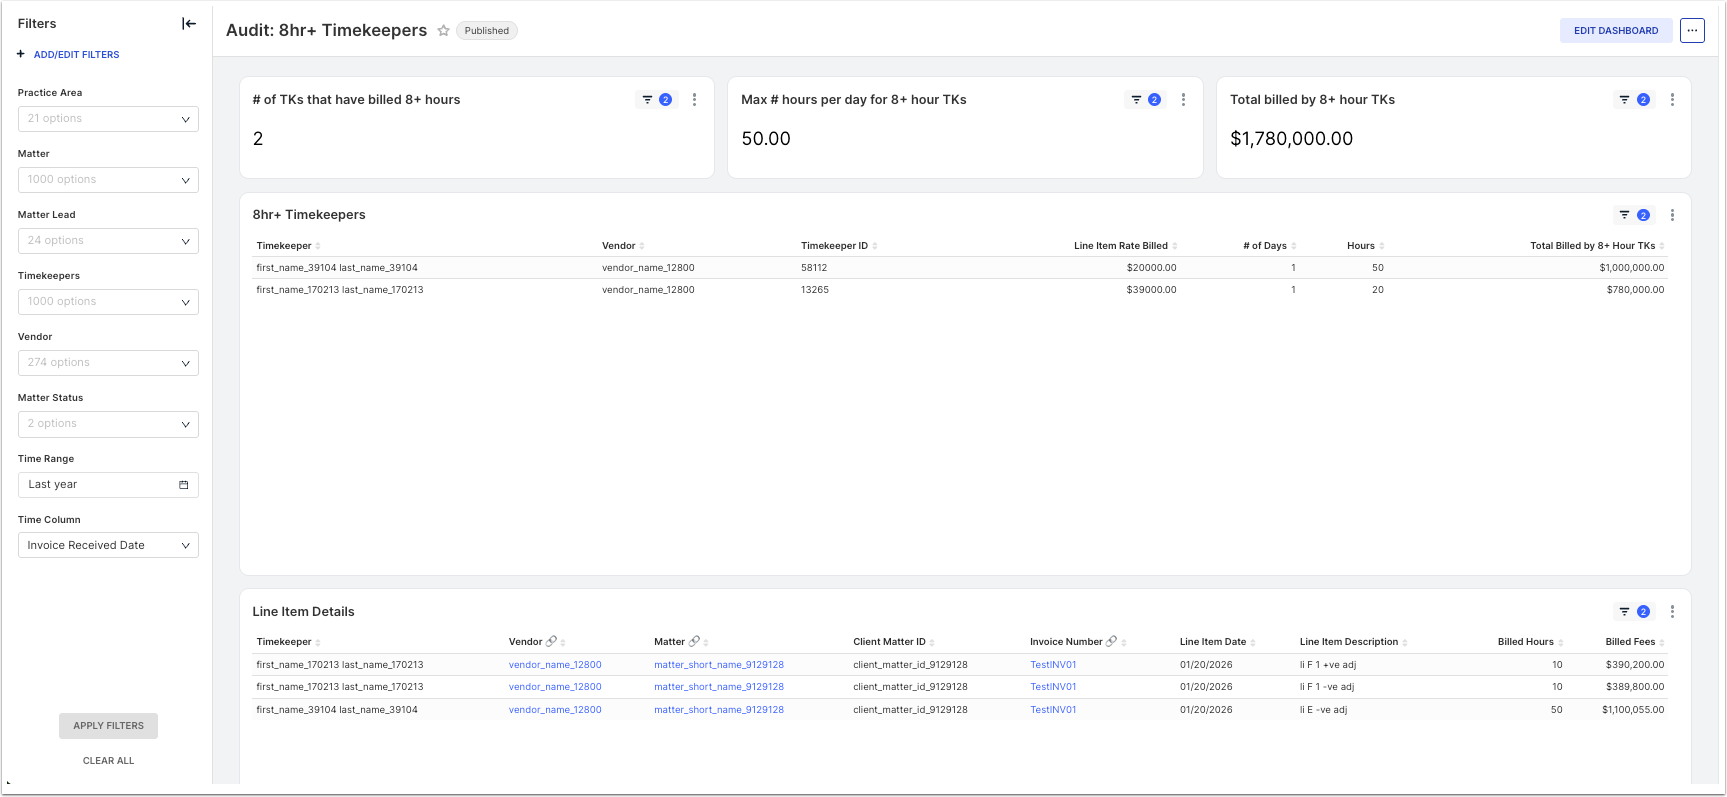
Let's break down the screen here:
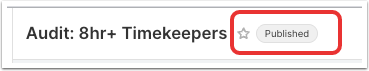
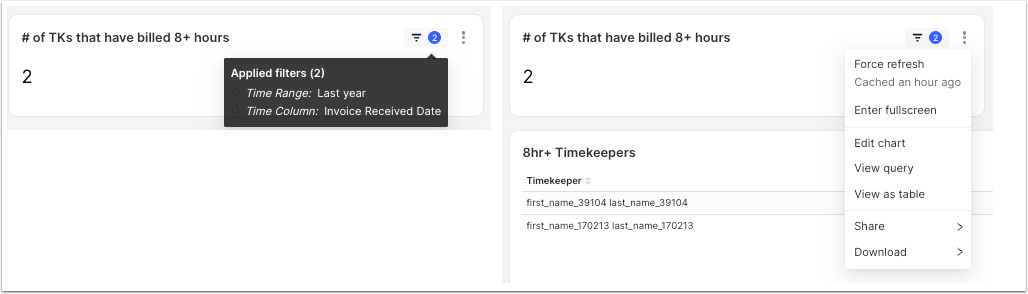
On the top of the screen, by the report name, you can Star the report to favorite it and see its publication status.
Different panels across the top of the screen will allow you to see vital insights. Clicking on the numbered, layered button will allow you to see the filters applied to that panel insight; clicking on the three-dots menu will allow you to Force refresh the information, Enter fullscreen, Edit the chart, View the Query, View as table, Share the information, or Download the information.
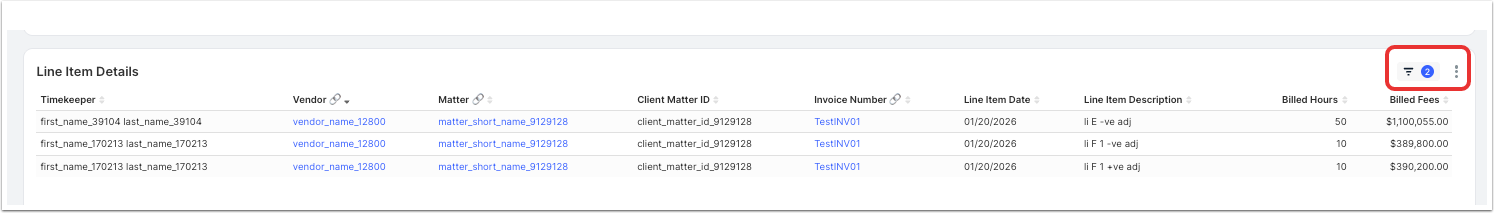
The Line Item Details section goes into more granular details about the items in the report. Click on the up/down arrows next to each column to sort by that amount; links will take you directly to the Vendor, Matter, Invoice Number, etc.
Clicking on the numbered, layered button will allow you to see the filters applied to that panel insight; clicking on the three-dots menu will allow you to Force refresh the information, Enter fullscreen, Edit the chart, View the Query, View as table, Share the information, or Download the information.
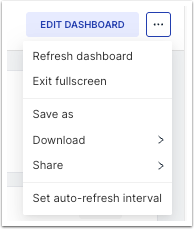
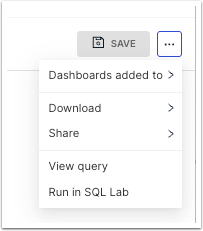
On the top right of the screen, the three-dot menu will allow you to Refresh the Dashboard, Exit fullscreen, Save the report, Download the report, Share the report, and Set the auto-refresh interval.
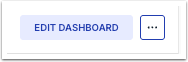
Click on Edit Dashboard to change what you'll see on the report dashboard screen.
In the Edit Dashboard screen, you can drag and drop the different sections to rearrange them to your liking. You can also Delete the different sections or use the Settings to determine the type of background to use.
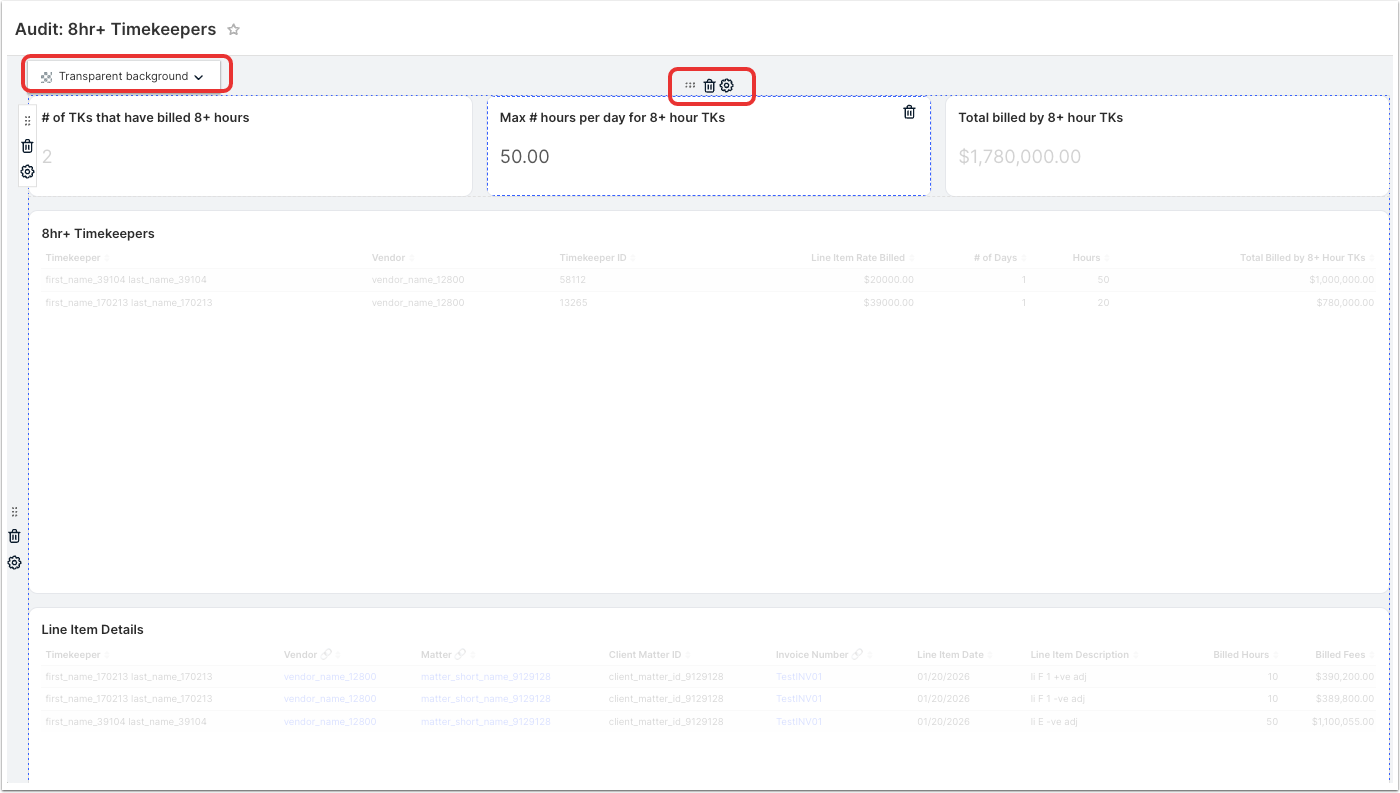
On the right-hand side of the screen, you can choose between Charts and Layout Elements to add to the screen.
Charts
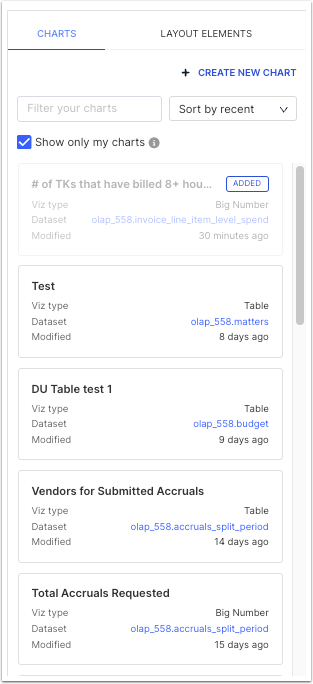
Under Charts, you can add in any necessary charts to the report. The list of reports will detail key information (Viz type, Dataset, and Modified date). You can choose to Show only my charts, use the search bar to search for a specific chart, or use the drop-down menu to sort by different categories.
The Charts tab includes: 1) charts from out-of-the-box reports provided by Unity, 2) charts you created or cloned/customized, and 3) charts created by other users in your environment.
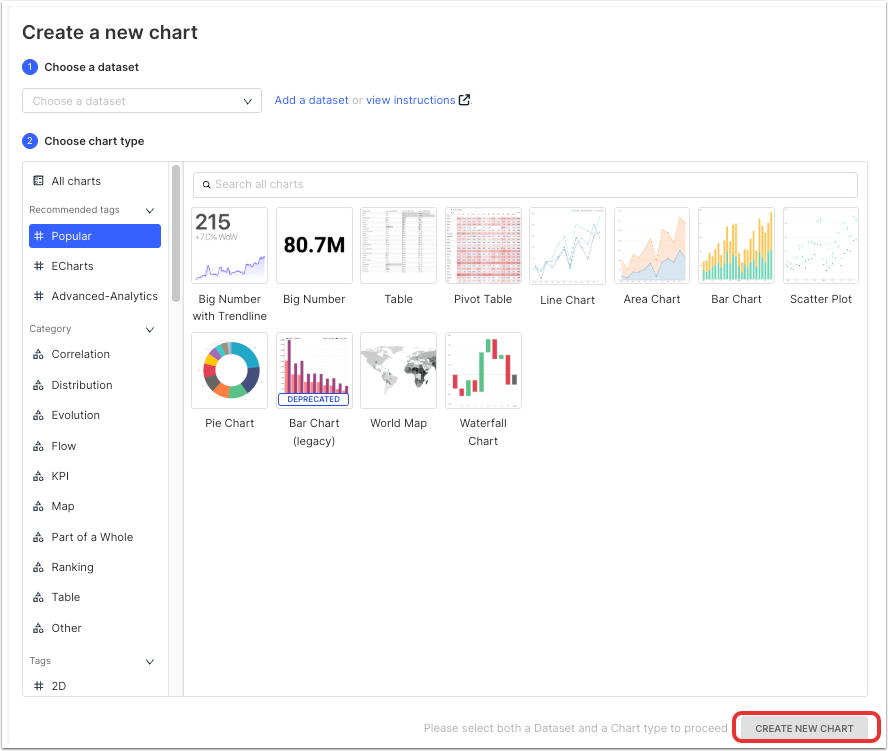
You can create an entirely new chart by clicking on Create New Chart.
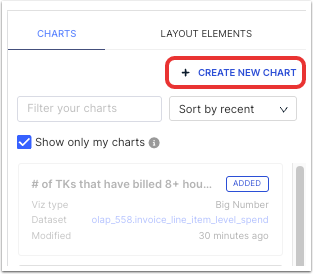
This will bring you to the Create a new chart page. Here, you can choose the Dataset and Chart Type and then click Create New Chart.
Once you click Create New Chart, you'll open the Charts screen. This is a powerful tool that allows you to add in or modify:
- The Name of the chart
- The Chart Source
- Metrics
- Columns
- Within the Query column, the Source, Target, Metric, Filters, and Row Limit
- Under the Data column, the type of chart
- Under the Customize column, the Number Format and Color Scheme from the drop-down menu
A preview of the chart will show up in the main screen. Click Create Chart to create the chart.
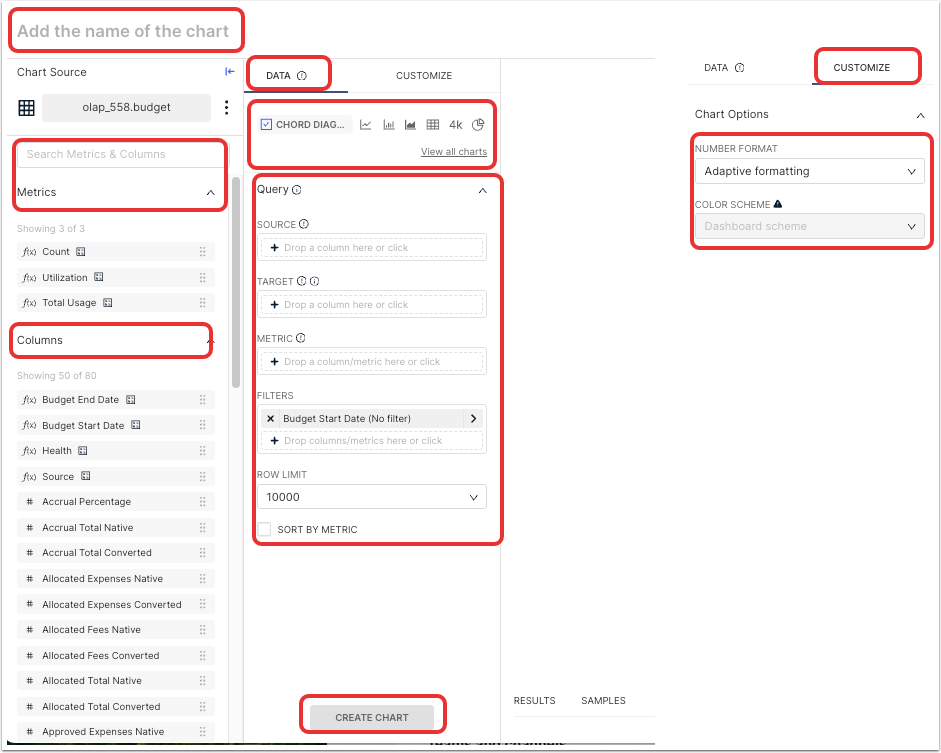
On the right-hand side of the screen, you can use the three-dots menu to adjust the Dashboards added to option, Download or Share that information, View query, or Run in SQL Lab. Click Save to save the report.
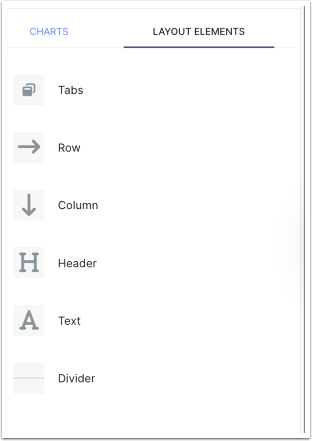
Layout Elements
Under Layout Elements, you can add in Tabs, Rows, Columns, Headers, Text, and Dividers. Each of them has their own customizable options.
| Layout Element | Description / Examples |
| Tabs | Tabs can be used to better organize data in a dashboard, similar to using tabs in a spreadsheet. This can also help with reducing loading time for dashboards with high volumes of data. You can add tabs across the top of a dashboard (see above) or embed tabs between other dashboard elements, such as below a row of charts or below a divider (see below). Tabs can also be added at the column level by dragging and dropping the tab onto a column, as shown in the image below: Column-level tabs are helpful if you want to add a similar version of a chart for comparison or to highlight related datapoints (e.g., two similar versions of a pie chart). This allows users to switch between the two charts instead of having to show the two charts side by side if you want to save space on the dashboard. |
| Row | Rows are used to organize one or more charts in a horizontal line on the dashboard (i.e., side by side, from left to right). The charts can then be resized and moved depending on the spacing and chart type. For example, you can add three equally sized Big Number charts in one row at the top of a dashboard to highlight key metrics. |
| Column | Columns provide additional customization and layout options for dashboards and are used to position different sized charts (i.e., top to bottom). For example, you can use a column to add a filter box chart on the left side of the dashboard and resize it to span multiple rows of charts. |
| Header | Headers can be used to separate and label a group of charts on a dashboard. This element allows limited formatting (e.g., size of text can be small, medium, or large). You can add top-level headers or add them between other dashboard elements, such as below a row or below a divider. This can also be useful in combination with tabs, for example. |
| Markdown | This option is used to add a section with text to a dashboard. This may be helpful for adding instructions or other tips/comments for users to reference while viewing a report dashboard. The text must be added in "markdown" format if styling/layout is required, such as headings, lists, or embedded videos. Use the dropdown above the text box to switch fromEdittoPreviewto see how the text will appear. Clickhereto review Github's Markdown Cheatsheet for more information. |
| Divider | Dividers can be used to add visual space between rows on a dashboard to further organize and/or separate data. |
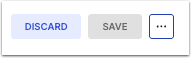
Click on Discard to discard your chart changes or Save to save your work.
Report Filtering
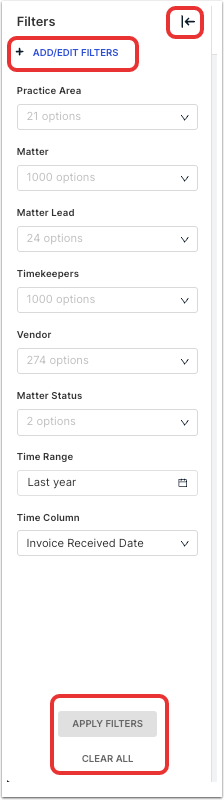
Apply or change criteria by using the filter box on the left side of the report through the drop-down menus. Filtering is instant for out-of-the-box reports.
Click the left arrow to minimize the filtering window. When you're done, you can click on Apply Filters or Clear All.
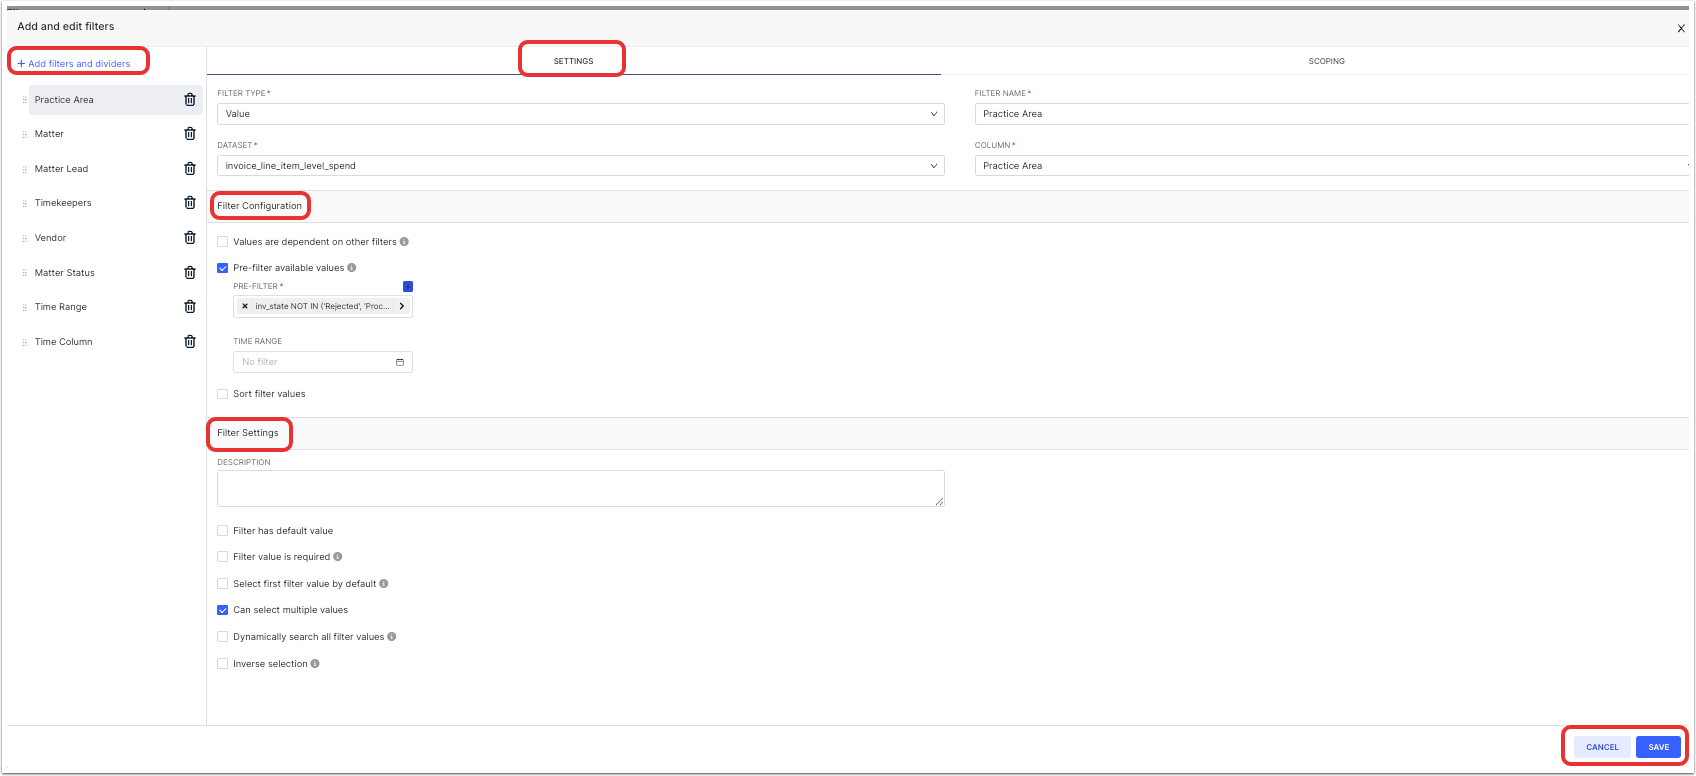
You can also add and edit filters thought the Add/Edit Filters option. There, you have a range of options for both the Settings and the Scoping.
Under the Settings, you can:
- Add, remove, or rearrange the filters and dividers
- Customize the Filter Type, Filter Name, Dataset, and Column
- Customize the Filter Configuration
- Customize the Filter Settings and add a Description
Click Save to save the changes or Cancel to back out.
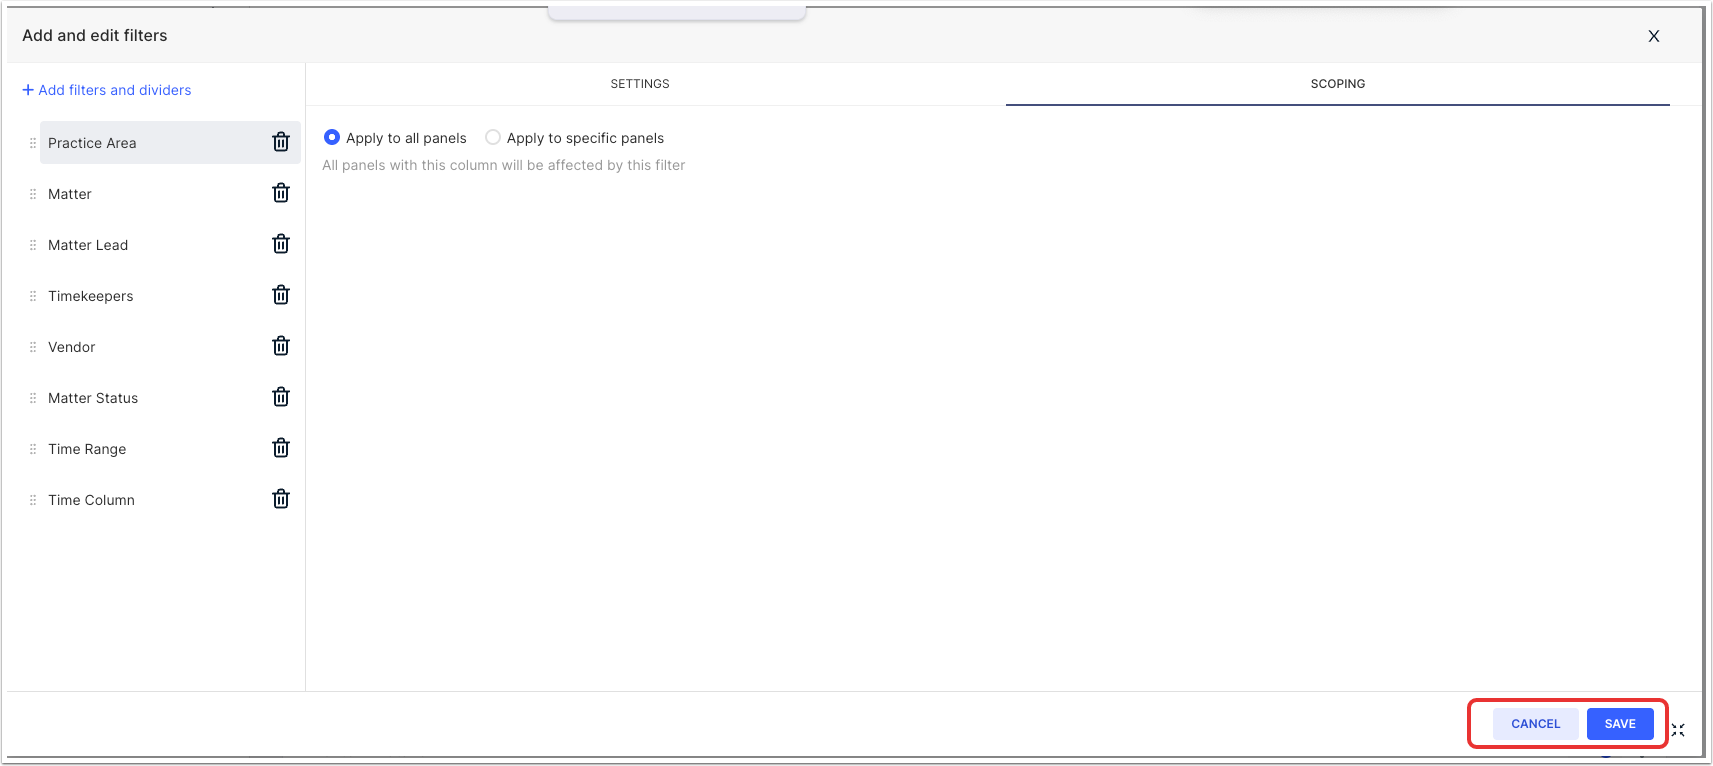
Under Scoping, you can choose to Apply to all panels or Apply to specific panels. Click Save to save the changes or Cancel to back out.
Using the Enhanced Reports Builder
Building Custom Reports in Enhanced Reporting
There are two options for building custom reports within Enhanced Reporting: the Adhoc Reports Builder and the Enhanced Reports Builder. To learn more about the Enhanced Reports Builder, click here.
Out-of-the-Box Enhanced Reports
Note that all Enhanced Reports users do have access to the "Out-of-the-Box" Enhanced Reports. See below for brief descriptions of out-of-the-box reports provided by Unity for Enhanced Reporting as of February 2025.
| Report Name | Baseline Enhanced Reporting Dataset | Description |
| 1000hr+ Invoices | Invoice Allocations Level Spend | Spend data for invoices that billed more than 1,000 hours for the selected time range; grouped by year, vendor, matter name, and invoice number. |
| 8hr+ Timekeepers | Invoice Line Item Level Spend | Timekeepers who billed more than 8 hours for the selected time range; provides high-level metrics and breakdowns by timekeeper. |
| AI-Powered Invoice Review | AI Powered Invoice Review | Provides quick insights into the performance of rules used to automatically flag invoice line items that violate billing guidelines (e.g., Block Billing, Vague, etc.). This report applies only to customers currently using Unity's AI-based invoice review feature. |
| Accruals (Single Period) | Accruals | NOTE: Single Period is available only to customers who allow vendors to submit accruals for one (single) period at a time. Provides quick insight into accrual submission activity to help customers determine whether vendor estimates are reliable for financial planning and identify areas for improvement. |
| Accruals (Split Period) | Accruals | NOTE: Split Period only appears for customers who have prior period accruals enabled in Unity, which allows vendors to submit accruals for a split (more than one) period at a time. Provides quick insight into accrual submission activity to help customers determine whether vendor estimates are reliable for financial planning and identify areas for improvement. |
| Accruals vs. Actuals (Single Period) | Accruals | NOTE: Single Period only appears for customers who allow vendors to submit accruals for one (single) period at a time. Compares spend projected by vendors and the actual invoiced amount for monthly reporting periods. |
| Accruals vs. Actuals (Split Period) | Accruals | NOTE: Split Period only appears for customers who have the prior period accruals enabled in Unity, which allows vendors to submit accruals for a split (more than one) period at a time. Compares spend projected by vendors and the actual invoiced amount for monthly reporting periods |
| Budget Health | Budgets | Overview of approved budgets for the selected time range, including overall budget health (i.e., within or over budget). |
| Legal Requests | Legal Requests | Highlights volume of legal requests submitted, how many were approved for conversion into matters, and the average time for reviewers to respond. Only applies to customers on the Max Matter Management plan who are currently using Unity's Legal Requests feature. |
| Matter Leads Workload | Matters | Key metrics and breakdown of matter volume and spend by assigned Matter Lead for the selected time range. |
| Matter Status | Matters | Highlights volume and lifespan of matters for the selected time range. |
| Billed Matters | Invoice Allocations Level Spend | Spend on matters and other key metrics, such as average billed rate and total number of matters, based on billing activity for the selected time range. Provides a breakdown of billed matters for reference. |
| Invoice-Paid Invoices | Invoice Allocations Level Spend | Granular look at paid invoices by year. |
| Invoice-Unpaid Invoices | Invoice Allocations Level Spend | Shows spend for unpaid invoices and whether those invoices have been pending payment for 90 days. |
| "Spend by" Reports | Invoice Allocations Level Spend | Series of reports that provide insights into total spend for various categories, including correlations between spend vs. average rates and percentage contributions towards total spend. Categories include vendor, practice area, matter, timekeeper, and task code. |
| Spend Grids | Invoice Allocations Level Spend | Series of reports that break down spend for various categories, including matter lead, vendor, and practice area. Reports highlight diverse aspects of spend data, including fees and number of matters. |
| Active Vendors | Vendors | Provides an overview of the volume of matters assigned to active vendors and associated legal spend, along with which vendor-related Unity modules and features were enabled/disabled for active vendors. |
| Timekeeper Rate Requests | Timekeepers | Provides quick insights into the volume, speed, and status of vendor-submitted timekeeper rate requests. Only applies to customers who are currently using the Timekeeper Rate feature in Unity. |
| Task Health | Matter Tasks | Provides insights on tasks across matters so that admins can identify gaps and have better visibility to make adjustments. Only applies to customers on the Max Matter Management plan who have the tasks feature enabled. |
| Task Productivity by Assignee | Matter Tasks | Provides a quick overview of tasks by assignee across matters to better help admins with workload planning. Only applies to customers on the Max Matter Management plan who have the tasks feature enabled. |
| Task Progress by Assignee | Matter Tasks | Helps admins measure progress on tasks so they can adjust priorities. Only applies to customers on the Max Matter Management plan who have the tasks feature enabled. |
| Document Management Status | Matters Document Management | Provides insights into how teams are utilizing the Unity Document Management System (DMS). Only applies to customers on the Max Matter Management plan who have the internal DMS enabled. |
| Events Utilization | Events | Gives customers better understanding of the volume and types of events being created for matters. Only applies to customers on the Max Matter Management plan who are using the Events Management feature. |
| Invoice Rejections | Invoice Rejections | Helps customers understand why invoices are being rejected, the method used for invoice rejections (i.e., manual or automatic), and whether there are vendors submitting invoices that repeatedly violate billing guidelines. |
| Matter Files Shared | Matters Document Management | Gives customers visibility into matter file-sharing activity to and from vendors via Unity and Counsel Exchange. Only applies to customers with a Matter Management plan. |
| General Files Shared | General Files | Gives customers visibility into general file-sharing activity to and from vendors via Unity and Counsel Exchange. Only applies to customers who have a Max Matter Management plan or Signature Spend Management plan. |
Enhanced Reporting Datasets
Charts can be built using the datasets described below. Click on a name below to see column definitions for each dataset (you must be logged into Unity to access).
| Dataset | Description/Notes |
| Accruals Single Period | Data for accruals in your environment at the matter and vendor levels. Useful for reporting on accruals activity and actual amounts to determine if vendors are consistently submitting estimates and if estimates are reliable for financial planning purposes. This dataset is for customers who allow vendors to submit accruals for only one (single) period at a time. This is the baseline dataset used in our out-of-the-box Accruals (Single Period) and Accruals vs. Actuals (Single Period) reports. |
| Accruals Split Period | Data for accruals in your environment at the matter and vendor levels. Useful for reporting on accruals activity and actual amounts to determine if vendors are consistently submitting estimates and if estimates are reliable for financial planning purposes. This dataset only applies to customers who have prior period accruals enabled in Unity, which allows vendors to submit accruals for a split (more than one) period at a time. This is the baseline dataset used in our out-of-the-box Accruals (Split Period) and Accruals vs. Actuals (Split Period) reports. |
| Invoice Level Spend | Data for invoice-level spend in your environment ranging from billed and final amounts to vendor-level information. Useful for reporting on upcoming spend (i.e., spend being reviewed) and approved or paid spend. |
| Invoice Line Item Level Spend | Data for invoice line items in your environment, ranging from general attributes for associated matters to spend-related totals. Useful for reporting at the line item level to determine if billed rates are consistent with billed amounts for various task, activity, and expense codes. This is the baseline dataset used in our out-of-the-box 8hr+ Timekeepers report. |
| Invoice Allocations Level Spend | Data for invoice-level allocations in your environment, ranging from general attributes for associated matters to spend-related totals. Useful for reporting on amounts allocated against accounting code sets to determine how respective allocation amounts are being tracked and utilized. This is the underlying dataset used for spend-based reports built using the Ad hoc Reports Builder and the baseline dataset used in out-of-the-box spend reports provided for Enhanced Reporting, such as Spend Grids and Billed Matters. |
| Invoice Rejections | Data for invoices that are rejected in Unity by reviewers or automatically based on billing rules. Useful for reporting on how rejection reasons are being applied across invoices to identify gaps or other areas of improvement. This is the baseline dataset used for the out-of-the-box Invoice Rejections report. |
| Matters | Data for matters in your environment, ranging from Legal Entities and Vendors to important activity/billing dates. Useful for reporting back on matter attributes to further break down or compare the distribution of legal entities, matter leads, and vendors across matters. This is the baseline dataset used in some of our matter-level out-of-the-box reports, such as Matter Status and Matter Leads Workload. |
| Vendors | Data for vendor records in your environment, such as recent billing activity and associated Vendor Groups (if applicable). Useful for highlighting or comparing matter volume across vendors or determining the distribution of matters across vendors based on location, Vendor Groups, or other attributes. This is the baseline dataset used in our out-of-the-box Active Vendors report. |
| Timekeepers | Data for timekeepers who bill for work on matters in your environment, including rates and spend totals. Useful for showcasing rates over time for comparison and providing better visibility into approvals vs. rejections for submission. This is the baseline dataset used in our out-of-the-box Timekeeper Rate Requests report. |
| Budgets | Data for approved budgets in your environment, including information related to budget health. Only applies if the budgets feature is enabled in Unity. Useful for providing better visibility into amounts/performance for both internal and external budgets (if applicable) at the matter or firm level. This is the baseline dataset used in our out-of-the-box Budget Health report. |
| Legal Requests | Data for legal requests submitted by users in your environment, including current status, reviewer names, form names, and associated matter names (if applicable). Applies if the Legal Requests feature is enabled and is only available to admin users with permissions to review/manage legal requests in your environment. This is the baseline dataset used in our out-of-the-box Legal Requests report. |
| AI Powered Invoice Review | Data recorded for AI rules in your environment, including rule performance and vendor insights. Only applies if Unity is enabled for AI-driven invoice review. Useful for seeing the potential savings associated with flagged line items and which rules yield the largest and smallest potential savings. This is the baseline dataset used in our out-of-the-box AI-powered invoice review report. |
| Events | Data captured for events created for matters in Unity. This dataset is available only to customers with the Max Matter Management plan. |
| Matters Document Management | Data captured for files uploaded to matters in Unity and/or shared with/by Counsel Exchange users for specific matters. This is the baseline dataset used in our out-of-the-box Document Management Status and Matter Files Shared reports. This dataset is for customers who are using Unity's Document Management System (DMS). |
| General Files | Data captured for files uploaded to vendor records in Unity and/or shared with/by Counsel Exchange users. This is the baseline dataset used in our out-of-the-box General Files Shared report. |
URL Attributes for Tables
For some Enhanced Reporting datasets, customers can add columns with URL attributes that link to relevant records in Unity, such as matters, vendors, legal entities, or invoice numbers, as shown in the example chart below. This allows viewers to quickly open associated records while reviewing reports without having to manually search for the information in Unity.
When building or editing charts, users with "create" permissions can add the URL attribute by dragging and dropping column names with the link icons to row or other query configurations as shown below:
Which column names have the URL attribute depend on the selected dataset and the record type.
Adding hyperlinked record names to charts is not required; you can still choose the standard column name labeled with the "ABC" data type if the URL is not applicable or desired.