Unity RFP customers have access to two standard reports within Onit's reporting tool for key insights into RFP usage:
- RFP Award Report, detailing awarded RFPs, including vendor fees, bid comparisons, vendor scores, cost reduction, and participation across the RFP process.
- RFP Overview Dashboard, tracking RFP adoption, awarded spend, cost reduction, cycle time, conversion, and vendor performance.
Here, we'll detail how to access and use these reports.
Opening Unity RFP Reports
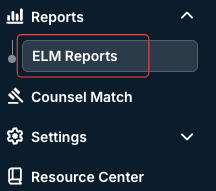
- Open the Reports feature on the left-hand side menu and click on "ELM Reports."
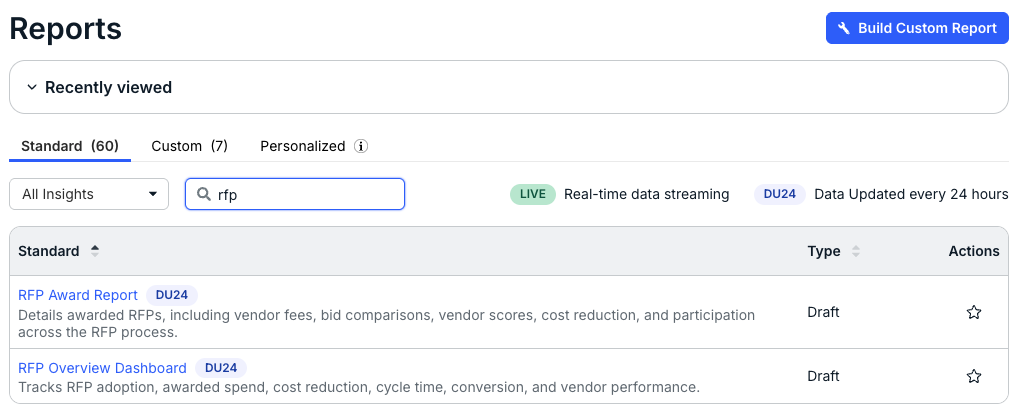
- You'll find the "RFP Award Report" and "RFP Overview Dashboard" under the "Standard" tab.
Note that you can type "RFP" in the Search insights search bar to filter down to those two reports.
- Click on either of the report types to open it.
RFP Award Report
The RFP Award Report details awarded RFPs, including vendor fees, bid comparisons, vendor scores, cost reduction, and participation across the RFP process.
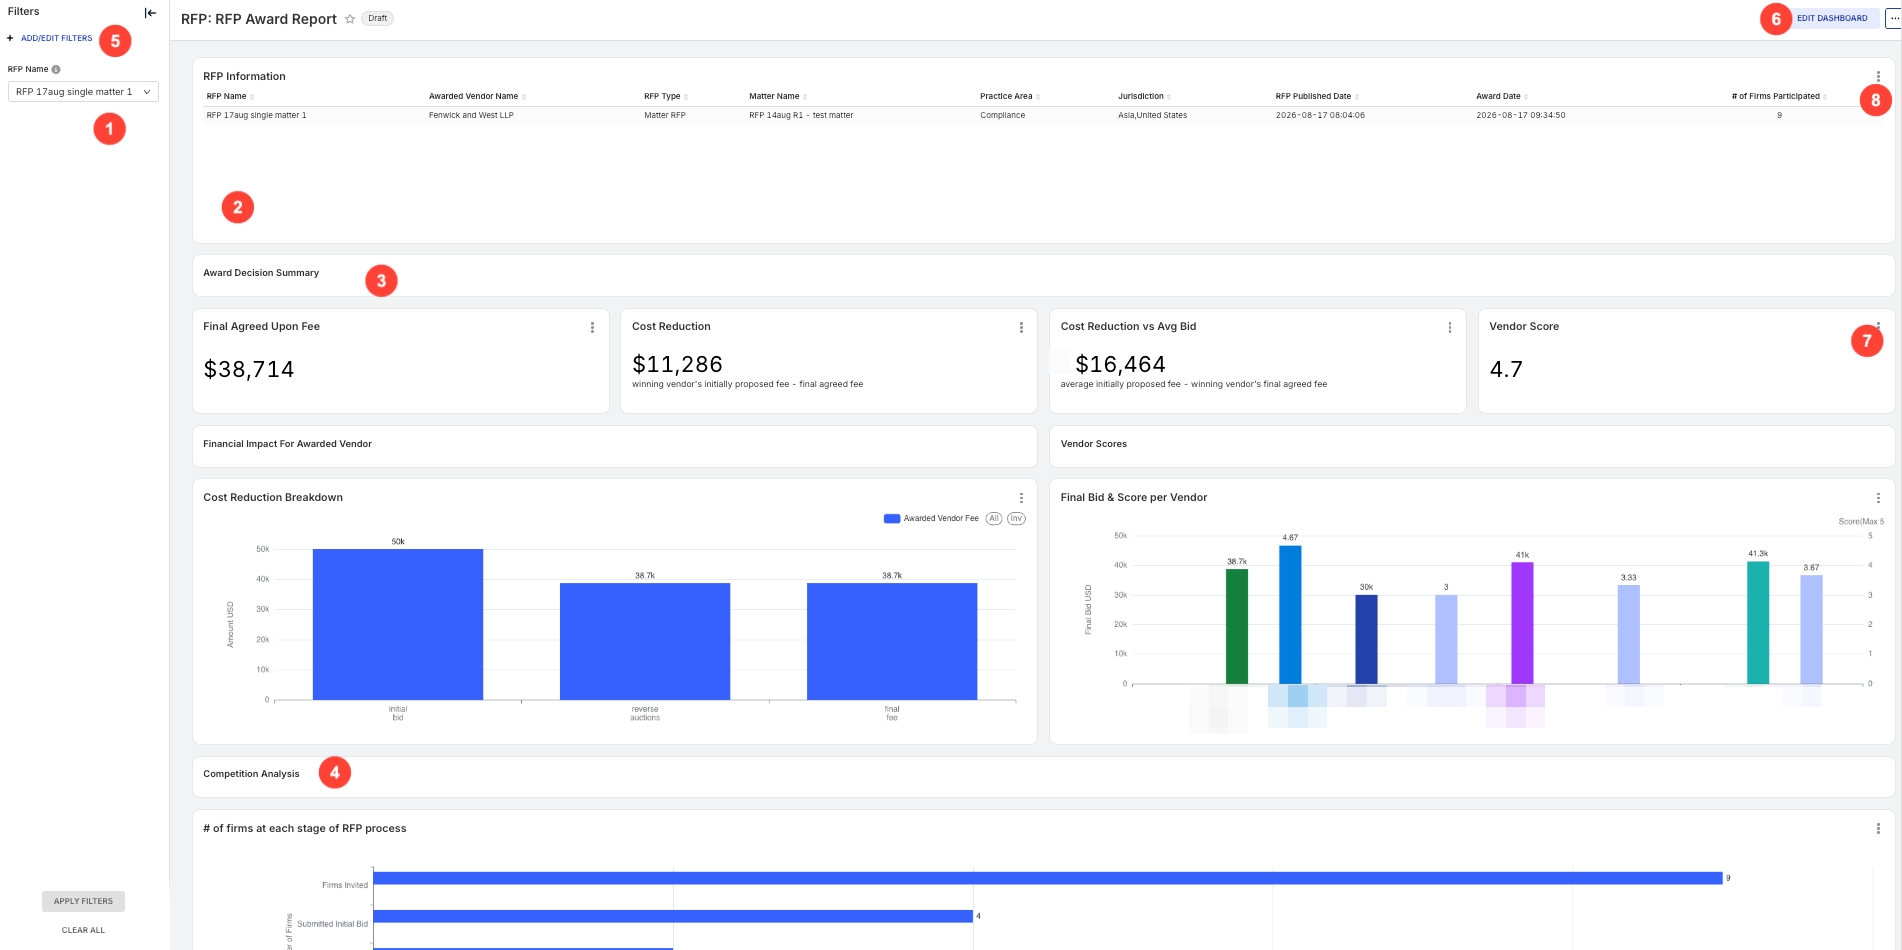
- Use the RFP Name drop-down menu to select the RFP you'd like to display on the screen.
- The RFP Information section shows key information about the RFP (Name, Awarded Vendor Name, RFP Type, Matter Name, Practice Area, Jurisdiction, RFP Published Date, Award Date, # of Firms Participated). Click the up/down arrow on each column to sort by that column.
The Award Decision Summary shows key financial information along with the Financial Impact for Awarded Vendor and Vendor Scores.
The main tiles will show the Final Agreed Upon Fee, Cost Reduction (winning vendor's initially proposed fee minus the final agreed upon fee), Cost Reduction vs. Average Bid (average initially proposed fee minus the winning vendor's final agreed upon fee), and Vendor Score. Click the three-dot menu at the top of any tile to customize it.

This section also includes accompanying charts for the Cost Reduction Breakdown and Final Bid & Score per Vendor. Click the three-dot Actions menu on the side of each graph to customize them, or hover over different sections of the graph to bring up more details.
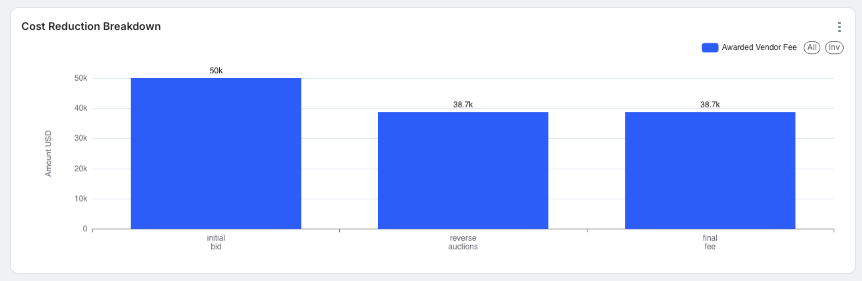
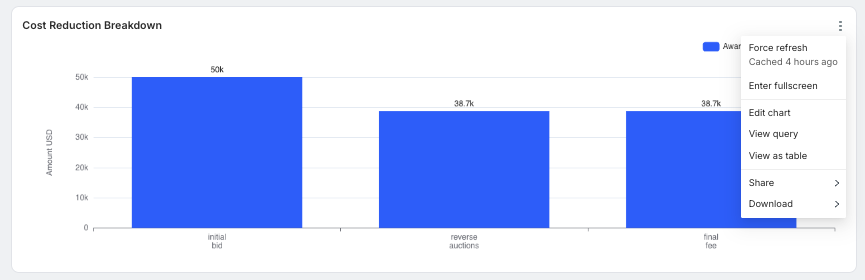
The Cost Reduction Breakdown chart will show you the Initial Bid, Reverse Auctions, Negotiations (if present), and the Final Bid amounts.
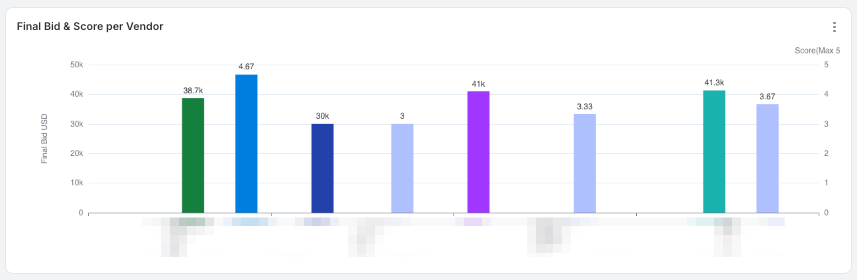
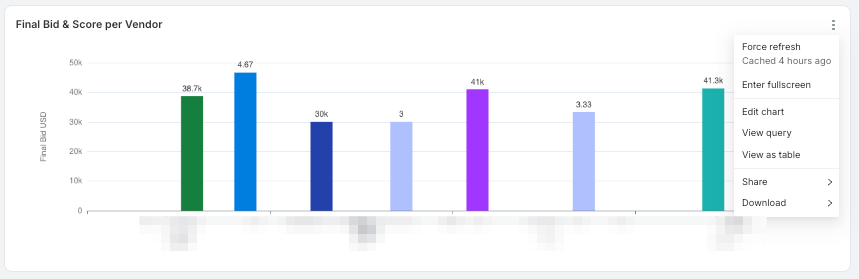
Final Bid & Score per Vendor plots out the final bid and Review Dimensions average score for each vendor.
The Competition Analysis breaks down competition data in a chart. In the # of firms at each stage of RFP process chart, you'll see how many firms were Invited, Submitted an initial bid, participated in Reverse Auctions, and were Awarded, broken down by RFP Stage. Click the three-dot Actions menu on the side of each graph to customize them, or hover over different sections of the graph to bring up more details.

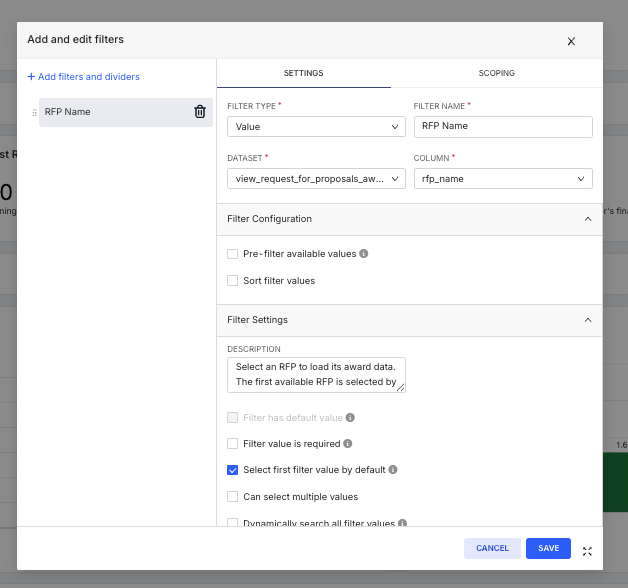
- Use the Add/Edit Filters screen to customize what you'd like to see on the screen. Note that you can also click the left (←) arrow to collapse the Filters side panel.
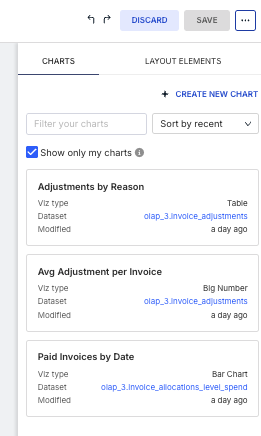
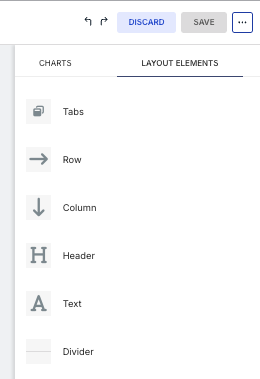
6. Click on Edit Dashboard to customize your report dashboard. You can switch between Charts and Layout Elements. Choose Discard to discard your changes or Save to save them.
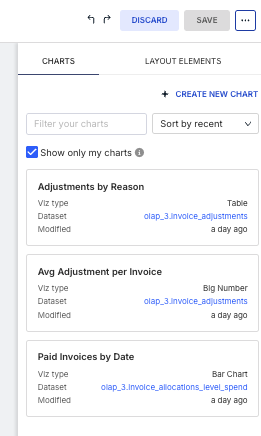
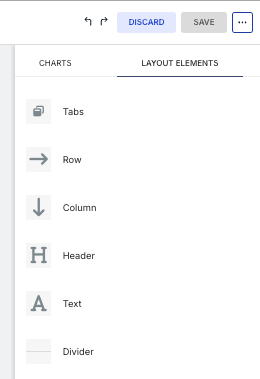
7. You can also click on the individual three-dot Actions menu on each section to customize that section.
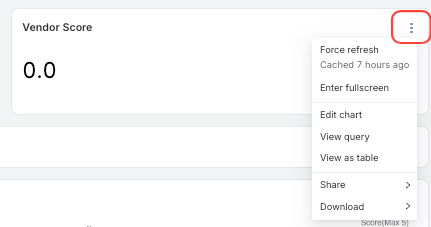
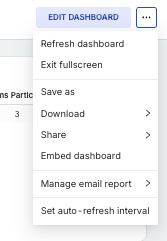
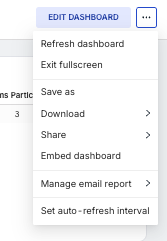
8. Use the main three-dot Actions menu to Refresh the dashboard, Enter/Exit fullscreen, Save as, Share, Embed dashboard, Manage email report, and Set auto-refresh interval.
RFP Overview Dashboard
The RFP Overview Dashboard tracks RFP adoption, awarded spend, cost reduction, cycle time, conversion, and vendor performance.
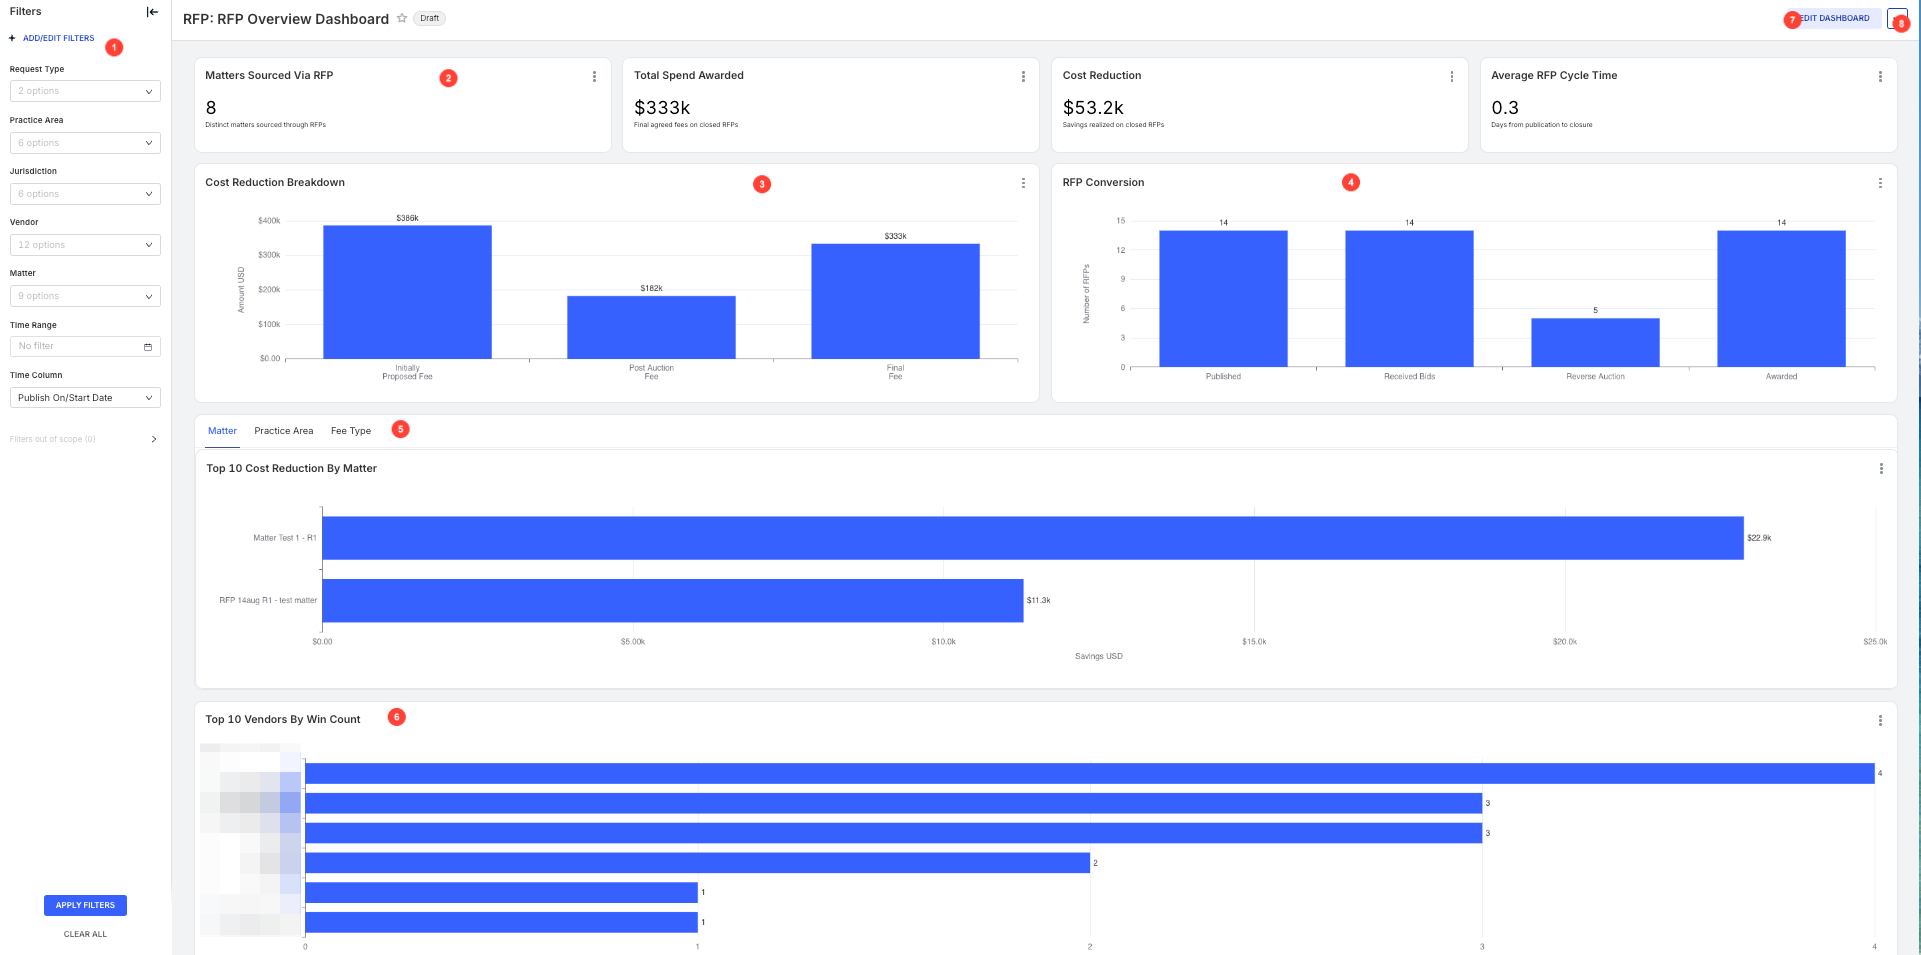
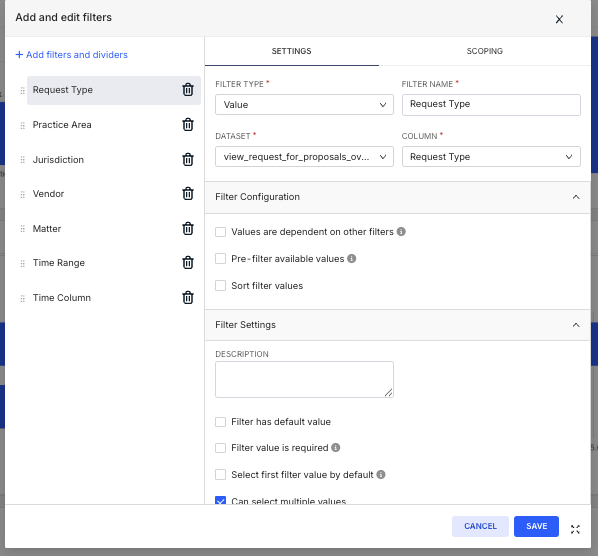
1. Use the drop-down menus to select what you'd like to display on the screen. Use the Add/Edit Filters screen to customize filters; click on Apply Filters to apply the filters or Clear All to clear the filters.
2. The top sections will display the Matters Sourced Via RFP, Total Spend Awarded, Cost Reduction, and RFP Cycle Time.
3. and 4. These sections chart the Cost Reduction Breakdown and RFP Conversion details. Click on different parts of the chart to see more detail, or the three-dot Actions menu to further customize the chart.
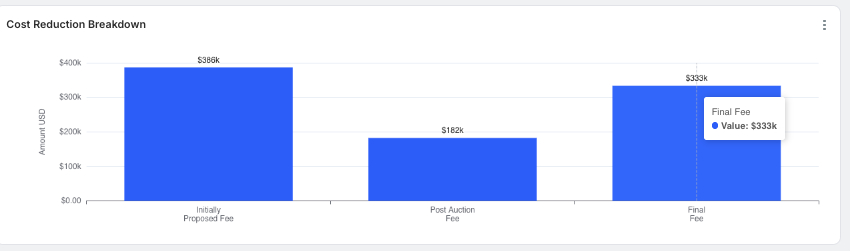
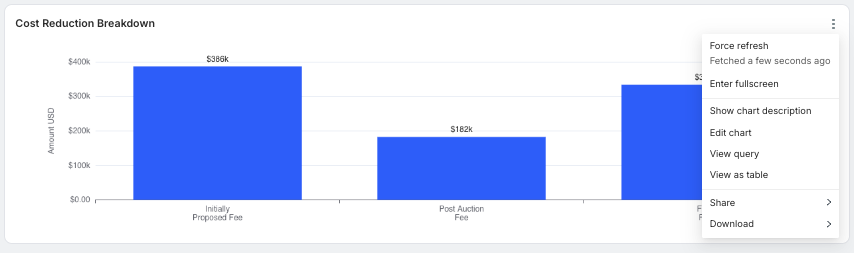
The Cost Reduction Breakdown shows Initially Proposed Fee, Post Auction Fee, Negotiations (if present), and Final Fee information.
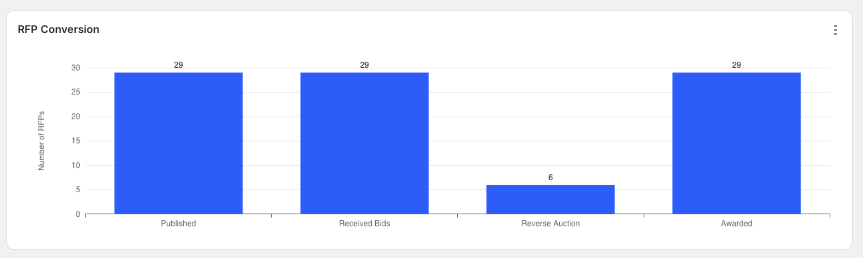
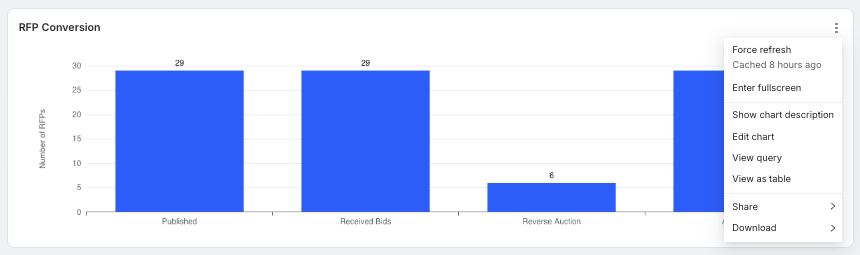
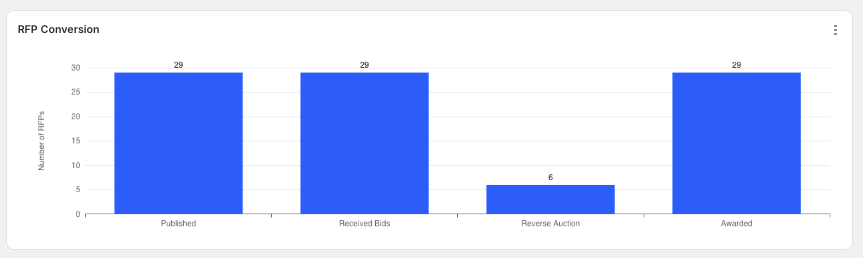
The RFP Conversion chart shows how many RFPs were Published, Received Bids, went to Reverse Auction, and were Awarded.
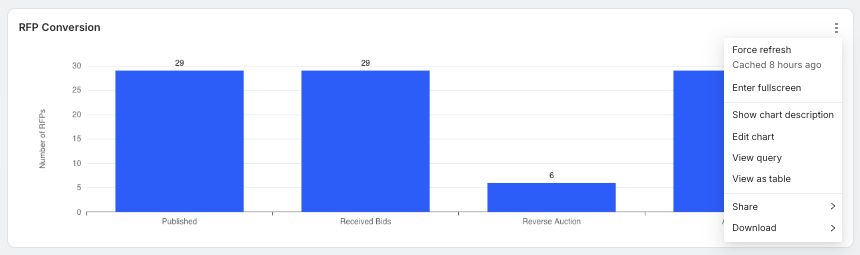
5. Use this section to switch between Matter, Practice Area, and Fee Type cost reduction charts; here, you can see the top cost reductions by these three categories.

6. This section shows the Vendors by Win Count, breaking down how many RFPs your top vendors have won. Click on different parts of the graph to see more detail, or the three-dot Actions menu to further customize the graph.

7. Click on Edit Dashboard to customize your report dashboard. You can switch between Charts and Layout Elements. Choose Discard to discard your changes or Save to save them.
8. Use the main three-dot Actions menu to Refresh the dashboard, Enter/Exit fullscreen, Save as, Share, Embed dashboard, Manage email report, and Set auto-refresh interval.